Al Horford is yet to bring his added value to the Warriors
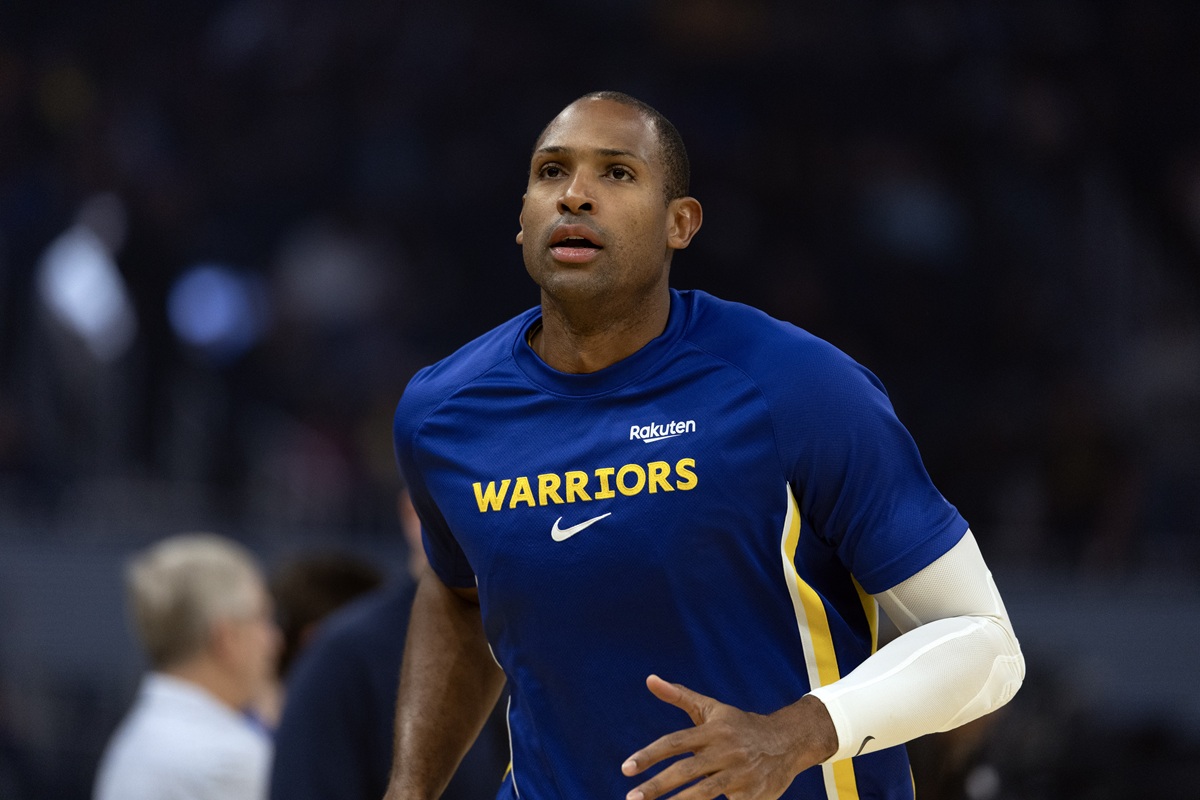 With his 5.6 points and 4.4 rebounds average, 32% shooting success and an implemented strategy of not playing consecutively in the whole, Al Horford does not achieve the start to the season envisioned at the time of his (late) signing at Golden State. He knows it, says it and assumes it.
“I’m not at the desired level. I wasn’t very good. I have a lot of work to do, I have to do more. I have to be better and I will be. But right now I’m not there”he points to The Athletic after the loss to the Sixers where he scored 3 points on 1/8 shooting.
But why isn’t it more efficient? Isn’t he frustrated? “Not so much”answers the inner NBA champion in 2024 and hampered for two weeks by a sciatica problem. “There are circumstances, different factors, whether it’s an injury, time away from the team. But I’m not looking for excuses.”
Be ready when it counts
It must be said that, in addition to the lack of rhythm, the performances are very average, sometimes even mediocreThe Warriors are not helping the 39-year-old. So be patient. “I felt good”he slides after match in Philadelphiahis first in two weeks. “Not playing is always a challenge, so I’m trying to get my legs back.”
For Al Horford, the most important thing is that in the spring, when serious things begin, he gains strength and has legs, rhythm and sensations. The warriors recruited him for that.
“I always have that in the back of my mind. I’m aware of that, but the team needs me right now.” he concludes. “We have to be better, but I know that when the time comes, I will have to be the best.”
| Al Horford | Percentage | Rebounds | |||||||||||||
|---|---|---|---|---|---|---|---|---|---|---|---|---|---|---|---|
| Saison | The team | MJ | Min | Shots | 3pts | LF | Off | Def | That | Pd | Ft | Int | Bp | Ct | Pts |
| 2007-08 | ATL | 81 | 31:21 | 49.9 | 0.0 | 73.1 | 3.1 | 6.6 | 9.7 | 1.5 | 3.3 | 0.7 | 1.7 | 0.9 | 10.1 |
| 2008-09 | ATL | 67 | 33:28 | 52.5 | 0.0 | 72.7 | 2.2 | 7.1 | 9.3 | 2.4 | 2.8 | 0.8 | 1.5 | 1.4 | 11.5 |
| 2009-10 | ATL | 81 | 35:07 | 55.1 | 100.0 | 78.9 | 2.9 | 7.0 | 9.9 | 2.3 | 2.8 | 0.7 | 1.5 | 1.1 | 14.2 |
| 2010-11 | ATL | 77 | 35:07 | 55.7 | 50.0 | 79.8 | 2.4 | 7.0 | 9.3 | 3.5 | 2.5 | 0.8 | 1.5 | 1.0 | 15.3 |
| 2011-12 | ATL | 11 | 31:38 | 55.3 | 0.0 | 73.3 | 2.4 | 4.6 | 7.0 | 2.2 | 1.9 | 0.9 | 1.5 | 1.3 | 12.4 |
| 2012-13 | ATL | 74 | 37:15 | 54.3 | 50.0 | 64.4 | 2.6 | 7.6 | 10.2 | 3.2 | 2.2 | 1.1 | 2.0 | 1.1 | 17.4 |
| 2013-14 | ATL | 29 | 33:02 | 56.7 | 36.4 | 68.2 | 2.3 | 6.1 | 8.4 | 2.6 | 1.9 | 0.9 | 2.2 | 1.5 | 18.6 |
| 2014-15 | ATL | 76 | 30:30 | 53.8 | 30.6 | 75.9 | 1.7 | 5.4 | 7.2 | 3.2 | 1.6 | 0.9 | 1.3 | 1.3 | 15.2 |
| 2015-16 | ATL | 82 | 10:05 p.m | 50.5 | 34.4 | 79.8 | 1.8 | 5.5 | 7.3 | 3.2 | 2.0 | 0.8 | 1.3 | 1.5 | 15.2 |
| 2016-17 | BOS | 68 | 10:15 p.m | 47.3 | 35.5 | 80.0 | 1.4 | 5.4 | 6.8 | 5.0 | 2.0 | 0.8 | 1.7 | 1.3 | 14.0 |
| 2017-18 | BOS | 72 | 31:38 | 48.9 | 42.9 | 78.3 | 1.4 | 5.9 | 7.4 | 4.7 | 1.9 | 0.6 | 1.8 | 1.1 | 12.9 |
| 2018-19 | BOS | 68 | 29:01 | 53.5 | 36.0 | 82.1 | 1.8 | 5.0 | 6.7 | 4.2 | 1.9 | 0.9 | 1.5 | 1.3 | 13.6 |
| 2019-20 | PHI | 67 | 30:13 | 45.0 | 35.0 | 76.3 | 1.5 | 5.3 | 6.8 | 4.0 | 2.1 | 0.8 | 1.2 | 0.9 | 11.9 |
| 2020-21 | OKC | 28 | 27:56 | 45.0 | 36.8 | 81.8 | 1.0 | 5.7 | 6.7 | 3.4 | 1.7 | 0.9 | 1.0 | 0.9 | 14.2 |
| 2021-22 | BOS | 69 | 29:03 | 46.7 | 33.6 | 84.2 | 1.6 | 6.1 | 7.7 | 3.4 | 1.9 | 0.7 | 0.9 | 1.3 | 10.2 |
| 2022-23 | BOS | 63 | 30:30 | 47.6 | 44.6 | 71.4 | 1.2 | 5.0 | 6.2 | 3.0 | 1.9 | 0.5 | 0.6 | 1.0 | 9.8 |
| 2023-24 | BOS | 65 | 26:46 | 51.1 | 41.9 | 86.7 | 1.3 | 5.1 | 6.4 | 2.6 | 1.4 | 0.6 | 0.7 | 1.0 | 8.6 |
| 2024-25 | BOS | 60 | 27:38 | 42.3 | 36.3 | 89.5 | 1.3 | 4.8 | 6.2 | 2.1 | 1.4 | 0.6 | 0.8 | 0.9 | 9.0 |
| 2025-26 | GS | 13 | 21:28 | 32.1 | 29.8 | 100.0 | 0.8 | 3.5 | 4.4 | 2.0 | 1.5 | 1.0 | 1.2 | 1.0 | 5.6 |
How to read statistics? MJ = matches played; Min = Minute; Shots = Shots Successful / Shots Attempted; 3 points = 3 points / attempt 3 points; LF = free throws made / free throws attempted; Off = offensive rebound; Def=defensive jump; Tot = Total number of jumps; Pd = assists; Fte: Personal mistakes; Int = intercepts; Bp = lost balls; Ct: Against; Points = Points.
2025-12-06 13:32:00